What Your Cholesterol Numbers Actually Mean
Educational Content Disclaimer: This article provides educational information only and is not intended as medical advice, diagnosis, or treatment. The content discusses general health topics and should not replace consultation with your licensed healthcare provider. Always consult with your doctor before making changes to your diet, supplements, or medications. Dr. JJ Gregor is a Doctor of Chiropractic licensed in Texas and practices within the scope of chiropractic care.
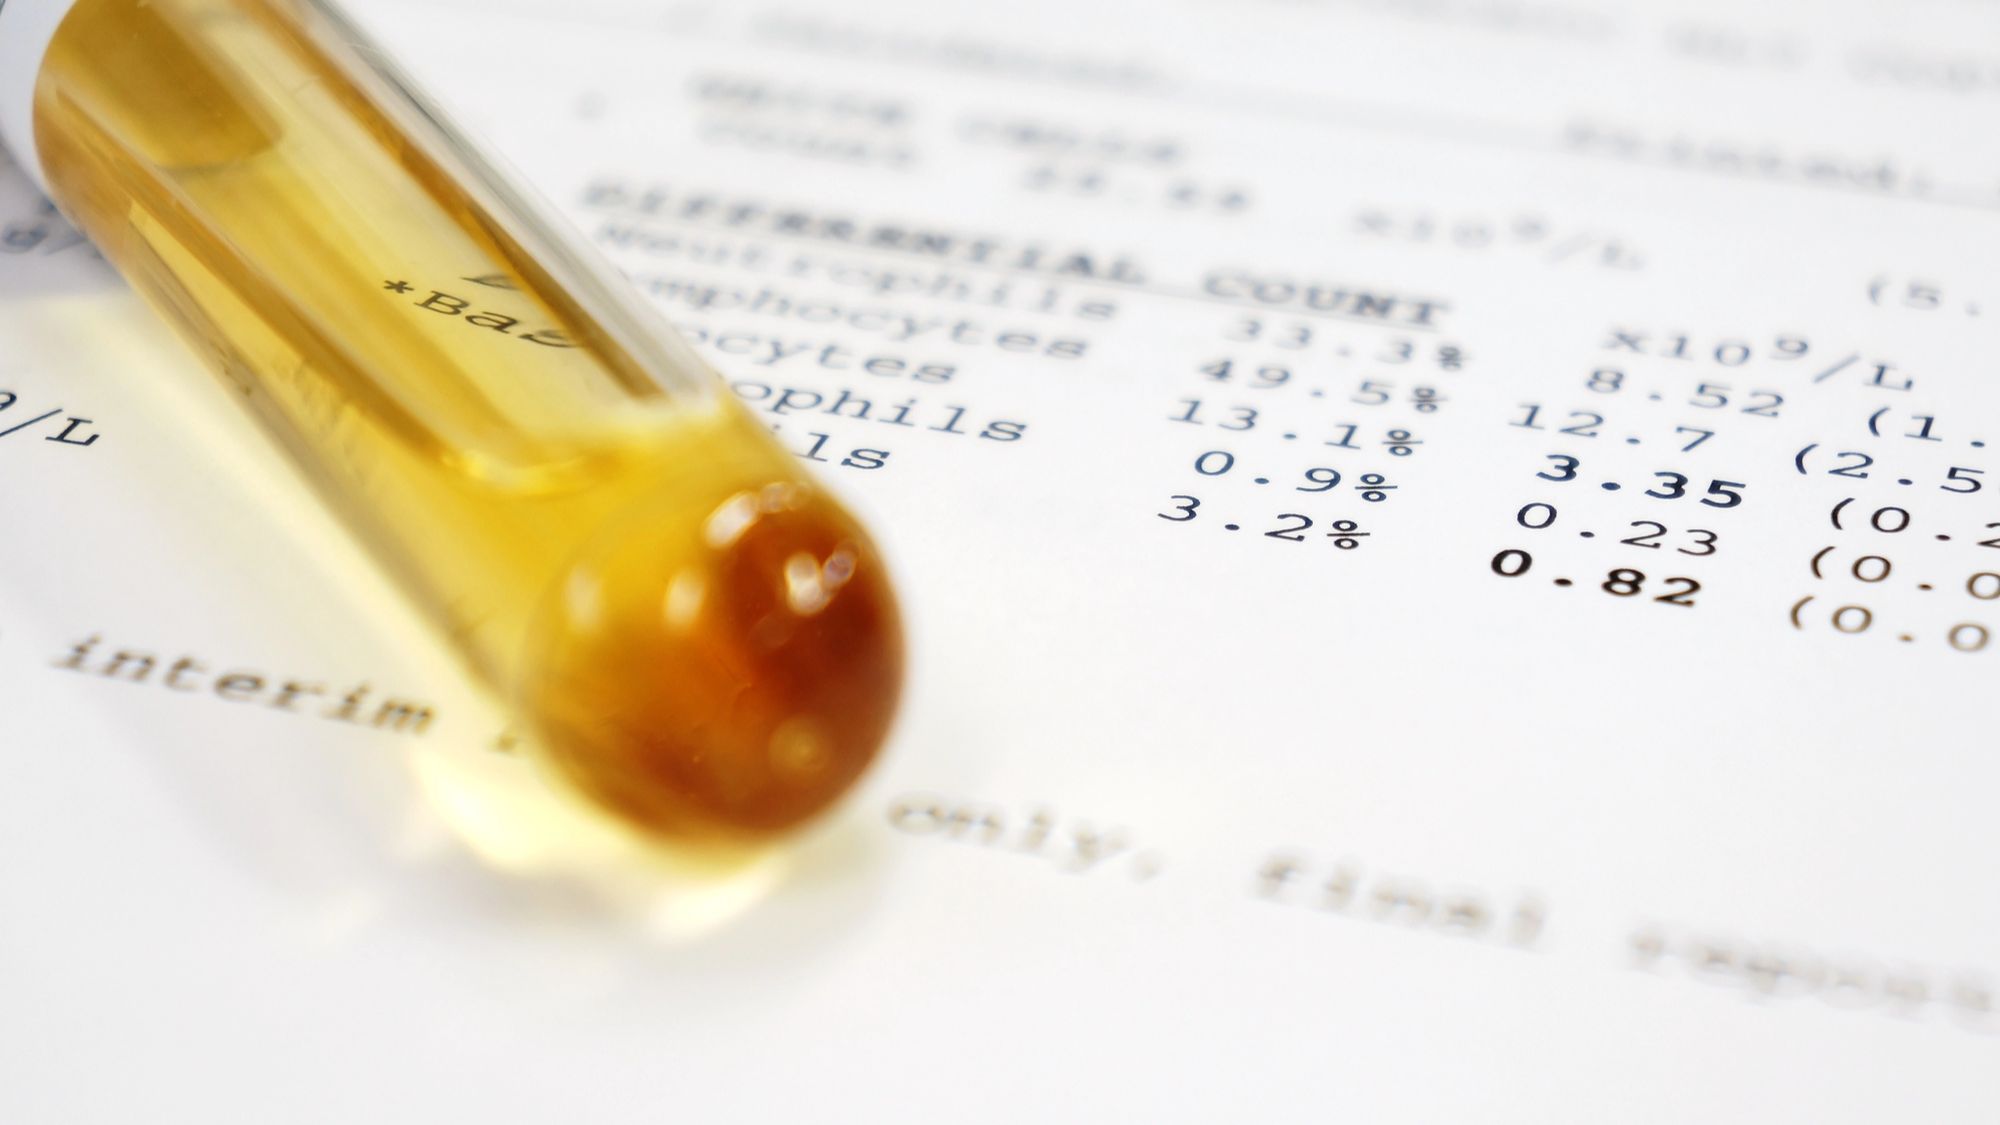
You get your cholesterol test results. You see a bunch of numbers. Your doctor says one thing. The internet says another.
What do these numbers actually mean?
More importantly: which numbers actually matter for heart disease risk?
Here's what your cholesterol panel is telling you and what it's not.
The Standard Cholesterol Panel
Most doctors order a basic lipid panel with four numbers:
- Total cholesterol
- LDL cholesterol
- HDL cholesterol
- Triglycerides
They look at these numbers, compare them to "normal" ranges, and make treatment decisions.
The problem? These numbers tell you almost nothing about your actual cardiovascular risk.
Total Cholesterol: The Most Useless Number
Standard "healthy" range: Below 200 mg/dL
Total cholesterol is the sum of all cholesterol in your blood. HDL + LDL + VLDL + other lipoproteins.
This number is essentially meaningless for predicting heart disease.
Why? Because it doesn't distinguish between protective cholesterol (HDL) and potentially problematic cholesterol (oxidized LDL).
You could have:
- Total cholesterol of 250 with HDL of 90 and low triglycerides = metabolically healthy
- Total cholesterol of 180 with HDL of 35 and high triglycerides = metabolically broken
The person with "high" total cholesterol is healthier than the person with "normal" total cholesterol.
Half of all heart attack victims have total cholesterol below 200. Half have it above 200.
It's a coin flip. The number doesn't predict anything.
Yet doctors prescribe statins based on this number alone.
LDL: It's Complicated
Standard "healthy" range: Below 100 mg/dL
LDL (low-density lipoprotein) carries cholesterol from your liver to cells that need it.
This is a normal, necessary function.
The problem isn't LDL itself. The problem is when LDL becomes oxidized by inflammation.
But standard cholesterol tests don't measure oxidation. They just measure total LDL.
This creates two critical problems:
Problem #1: LDL-C vs. LDL-P
Standard tests measure LDL-C (LDL cholesterol concentration).
What actually matters is LDL-P (LDL particle number).
Here's why:
You can have the same LDL-C with vastly different particle counts.
Example 1: LDL-C of 130 made up of 1,000 large, fluffy particles
Example 2: LDL-C of 130 made up of 2,000 small, dense particles
Same LDL-C. Completely different risk.
Small, dense LDL particles are more likely to oxidize and penetrate arterial walls. Large, fluffy particles are benign.
Standard cholesterol tests can't tell the difference.
Problem #2: Particle Size Matters More Than Number
You can have:
- Pattern A: Large, fluffy LDL particles (low risk)
- Pattern B: Small, dense LDL particles (high risk)
Pattern A LDL doesn't cause heart disease. It's too large to penetrate arterial walls easily.
Pattern B LDL is dangerous. Small particles slip into arterial walls, oxidize, and trigger inflammation.
What determines particle size?
High insulin and blood sugar dysfunction create small, dense LDL particles.
Fix your blood sugar and insulin resistance, and particle size improves even if LDL-C stays the same.
HDL: Higher Is Usually Better
Standard "healthy" range: Above 40 mg/dL (men), above 50 mg/dL (women)
HDL (high-density lipoprotein) transports excess cholesterol back to your liver for disposal.
It's called "good cholesterol" because higher levels are generally protective.
HDL also:
- Reduces inflammation
- Prevents LDL oxidation
- Supports immune function
- Protects arterial walls
Low HDL (below 40 for men, below 50 for women) indicates metabolic dysfunction.
What lowers HDL?
- Insulin resistance and high blood sugar
- Industrial seed oils
- Smoking
- Sedentary lifestyle
- Low-fat diets (ironically)
What raises HDL?
- Eating healthy fats (saturated and monounsaturated)
- Exercise (especially resistance training)
- Moderate alcohol consumption
- Weight loss
Optimal HDL: Above 60 mg/dL
Triglycerides: The Canary in the Coal Mine
Standard "healthy" range: Below 150 mg/dL
Triglycerides are fats in your bloodstream.
High triglycerides don't come from eating fat. They come from eating sugar and refined carbohydrates.
When you eat more carbs than your body can use, your liver converts the excess into triglycerides.
High triglycerides (above 150) indicate:
- Insulin resistance
- Poor blood sugar control
- Excessive carbohydrate consumption
- Metabolic dysfunction
High triglycerides also drive small, dense LDL particle formation.
This is why high triglycerides + low HDL is such a dangerous combination.
Optimal triglycerides: Below 100 mg/dL, ideally below 70 mg/dL
The Ratio That Actually Matters
Forget total cholesterol. Forget LDL alone.
The single best predictor of heart disease risk from a standard lipid panel is the triglyceride:HDL ratio.
Divide your triglycerides by your HDL.
Example 1: Triglycerides 150, HDL 50 = 3:1 ratio (high risk)
Example 2: Triglycerides 70, HDL 70 = 1:1 ratio (low risk)
Ideal ratio: Below 2:1
Acceptable: 2:1 to 3:1
Concerning: Above 3:1
This ratio tells you about insulin sensitivity, metabolic health, and LDL particle quality all in one number.
Low ratio (under 2:1) = large, fluffy LDL particles, good insulin sensitivity, low inflammation
High ratio (above 3:1) = small, dense LDL particles, insulin resistance, high inflammation
Advanced Testing: What Actually Matters
Standard cholesterol panels miss most of what determines cardiovascular risk.
If you want real information, ask your doctor for advanced testing:
1. LDL Particle Number (LDL-P)
Measures the actual number of LDL particles, not just cholesterol concentration.
Test: NMR LipoProfile or CardioIQ
Optimal LDL-P: Below 1,000 nmol/L
2. LDL Particle Size
Determines if you have Pattern A (large, fluffy) or Pattern B (small, dense).
Test: NMR LipoProfile
Pattern A = low risk, Pattern B = high risk
3. Apolipoprotein B (ApoB)
Every atherogenic particle (LDL, VLDL, IDL, Lp(a)) contains one ApoB protein.
ApoB measures total atherogenic particle count.
Optimal ApoB: Below 80 mg/dL
4. Lipoprotein(a) - Lp(a)
A genetic variant of LDL that's highly inflammatory and thrombogenic.
High Lp(a) significantly increases heart disease risk independent of other factors.
Test once: Lp(a) is genetically determined and doesn't change much
Concerning: Above 30 mg/dL or 75 nmol/L
You can't lower Lp(a) with diet. If it's high, focus on reducing other risk factors (inflammation, insulin resistance, oxidative stress).
5. hs-CRP (High-Sensitivity C-Reactive Protein)
Measures inflammation.
Inflammation is what makes LDL dangerous. Normal LDL in an inflamed environment becomes oxidized LDL.
Optimal hs-CRP: Below 1.0 mg/L
Concerning: Above 3.0 mg/L
6. Homocysteine
An amino acid that damages arterial walls when elevated.
Remember: cholesterol shows up to repair arterial damage, it doesn't cause it.
High homocysteine creates the damage that cholesterol tries to heal.
Optimal homocysteine: Below 7 µmol/L
Concerning: Above 10 µmol/L
High homocysteine indicates deficiencies in B vitamins (B6, B12, folate) or methylation problems.
7. Fasting Insulin
Insulin drives inflammation, promotes small dense LDL, and damages arterial walls.
High insulin is one of the strongest predictors of heart disease.
Standard doctors never test fasting insulin. They wait until you're diabetic (high glucose) to intervene.
By then, you've had elevated insulin damaging your arteries for years.
Optimal fasting insulin: Below 5 µIU/mL
Concerning: Above 10 µIU/mL
Optimal vs. Normal Ranges
Standard lab ranges are based on population averages, including sick people.
"Normal" doesn't mean "optimal."
Here's what you should actually aim for:
Total Cholesterol: Don't worry about it (150-300 can all be healthy depending on context)
LDL-C: 80-130 mg/dL (context dependent, particle size matters more)
HDL: Above 60 mg/dL
Triglycerides: Below 70 mg/dL
Triglyceride:HDL Ratio: Below 2:1
LDL-P: Below 1,000 nmol/L
ApoB: Below 80 mg/dL
hs-CRP: Below 1.0 mg/L
Homocysteine: Below 7 µmol/L
Fasting Insulin: Below 5 µIU/mL
What Your Numbers Actually Tell You
Scenario 1: Metabolically Healthy
- Total cholesterol: 220
- LDL: 140
- HDL: 75
- Triglycerides: 60
- Triglyceride:HDL ratio: 0.8:1
Assessment: Excellent metabolic health despite "high" total cholesterol and LDL.
High HDL and low triglycerides indicate large, fluffy LDL particles and good insulin sensitivity.
This person does NOT need statins.
Scenario 2: Metabolically Dysfunctional
- Total cholesterol: 190
- LDL: 120
- HDL: 38
- Triglycerides: 180
- Triglyceride:HDL ratio: 4.7:1
Assessment: Poor metabolic health despite "normal" total cholesterol.
Low HDL and high triglycerides indicate small, dense LDL particles, insulin resistance, and inflammation.
This person needs metabolic intervention (fix diet, blood sugar, insulin), not statins.
Why Doctors Get This Wrong
Most doctors were trained to:
- Look at LDL and total cholesterol
- Compare to population "normal" ranges
- Prescribe statins if numbers are "high"
They're not trained to:
- Order advanced testing (particle size, LDL-P, ApoB)
- Interpret triglyceride:HDL ratios
- Measure inflammation and insulin
- Address root causes (insulin resistance, inflammation, oxidative stress)
They're treating numbers, not metabolic health.
For more on why the cholesterol-heart disease hypothesis is flawed, read: Cholesterol: The Myth That Won't Die.
For basic cholesterol education, start here: What Is Cholesterol?
What To Do With Your Numbers
If Your Triglycerides Are High (Above 100)
- Cut sugar and refined carbohydrates completely
- Reduce total carbohydrate intake (focus on protein and fat)
- Eliminate industrial seed oils
- Exercise regularly (especially resistance training)
- Lose excess weight
Triglycerides respond quickly to dietary changes. You can drop them 50-100 points in 30 days.
If Your HDL Is Low (Below 50)
- Eat more healthy fats (saturated and monounsaturated)
- Strength train 2-3x per week
- Lose excess body fat
- Stop eating industrial seed oils
- Consider moderate alcohol (if appropriate)
HDL responds more slowly. Expect 3-6 months to see significant improvement.
If Your Triglyceride:HDL Ratio Is High (Above 2:1)
This indicates insulin resistance and metabolic dysfunction.
- Stabilize blood sugar (protein and fat at every meal, eliminate sugar)
- Address insulin resistance (low-carb or carnivore elimination diet)
- Manage stress (cortisol drives insulin resistance)
- Sleep 7-9 hours (poor sleep worsens insulin resistance)
- Strength train consistently (builds insulin-sensitive muscle)
For comprehensive nutrition strategies that support metabolic health, visit the Fuel Your Body pillar page.
If Inflammation Markers Are High (hs-CRP, Homocysteine)
- Remove inflammatory foods (seed oils, sugar, grains)
- Increase omega-3 intake (wild fish, grass-fed meat)
- Support methylation (B vitamins for high homocysteine)
- Heal gut health (bone broth, fermented foods, eliminate irritants)
- Stay hydrated
For stress management strategies that reduce inflammation, visit the Regulate Your System pillar page.
The Bottom Line
Standard cholesterol numbers (total cholesterol, LDL) don't predict heart disease risk.
What actually matters:
- Triglyceride:HDL ratio (best predictor from standard panel)
- LDL particle size and number (requires advanced testing)
- Inflammation (hs-CRP, homocysteine)
- Insulin and blood sugar control
You can have "high" cholesterol and be metabolically healthy. You can have "normal" cholesterol and be at high risk.
The numbers don't tell the whole story. Context matters.
Don't let a doctor prescribe statins based on LDL or total cholesterol alone. Demand advanced testing. Look at the full metabolic picture.
Address root causes (insulin resistance, inflammation, oxidative stress) rather than suppressing numbers with medication.
Your cholesterol is trying to tell you something about your metabolic health. Listen to it.
Ready to optimize your metabolic health? Dr. JJ Gregor provides comprehensive functional health evaluations at his Frisco, Texas practice. Schedule a consultation to understand your unique metabolic patterns and develop a personalized strategy for cardiovascular and overall health.
Stay connected with news and updates!
Join our mailing list to receive the latest news and updates from our team.
Don't worry, your information will not be shared.